Germany’s Electricity Mix: Power Generation by Source

ELECTRICITY MIX IN GERMANY
The term electricity mix (or power mix) refers to the share each energy source contributes to Germany’s total electricity generation.
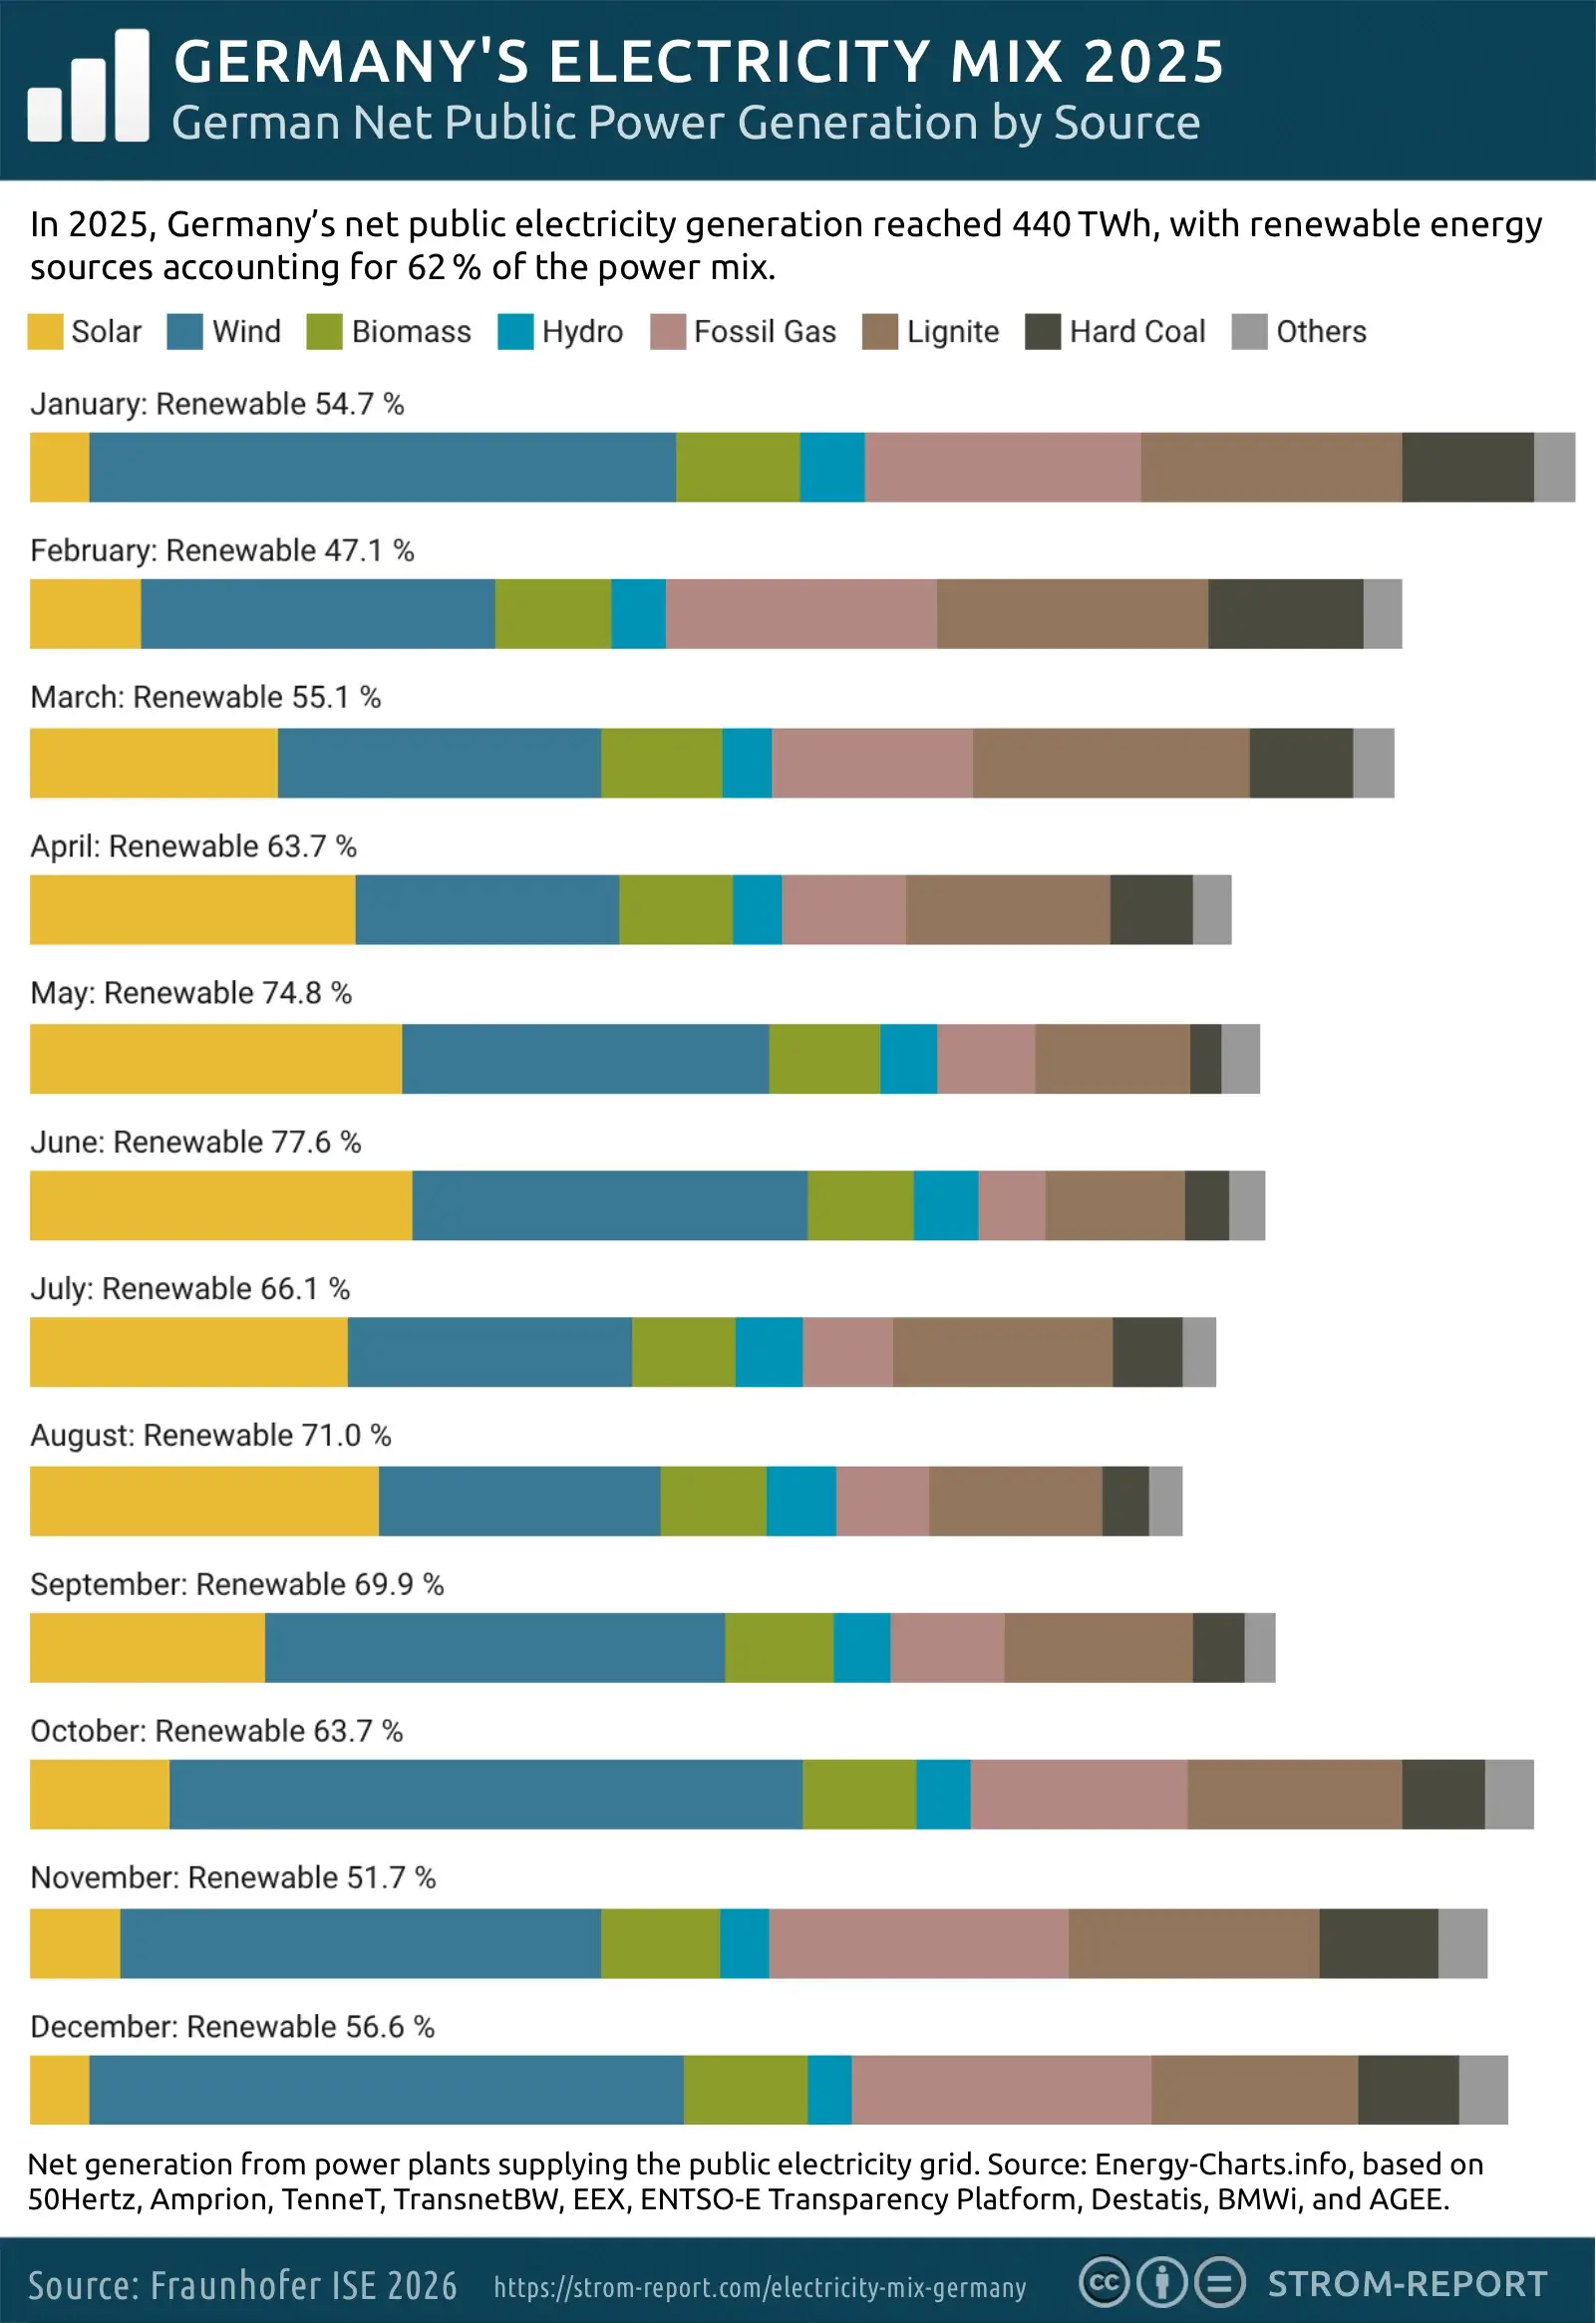
The contribution of each energy source to the electricity mix changes from day to day. This reflects Germany’s high share of renewable energy, as power generation responds to seasonal patterns, time of day, and weather conditions. The effect is most visible over the course of a year: long, sunny summer days deliver substantially higher solar output than the winter months.
The share of fossil fuels in Germany’s electricity mix has been declining steadily since 2002. Since last year, nuclear power is no longer part of domestic electricity generation. In parallel, renewable energy sources have continued to gain importance. Germany aims to cover 80% of its electricity mix with renewables by 2030 - and current figures indicate steady progress.
In 2024, renewables accounted for a record 63% of the public electricity mix. In 2025, the share has remained at a similarly high level: wind, solar, and other renewable sources generated 62% of the electricity fed into the public grid.
Key Facts on Germany’s Electricity Mix 2025
- In 2025, Germany generated 499 TWh of electricity. Of this total, 440 TWh were fed into the public grid—slightly more than in 2024 (public net electricity generation).
- Total renewable electricity generation reached 282 TWh in 2025, with 260 TWh supplied to the public grid. Renewables accounted for 62% of the public electricity mix.
- For the first time, wind and solar power provided the largest combined share of Germany’s public net electricity generation, totaling 202 TWh.
- Solar installations in Germany fed more than 70 TWh of electricity into the public grid in 2025, the highest level on record. An additional 16.9 TWh were consumed on-site—both new records.
- Self-consumption of renewable electricity amounted to 22 TWh in 2025.
- Electricity generation from coal fell to a new low of 94 TWh in 2025.
- CO₂ emissions from electricity generation in Germany totaled 160 million tonnes in 2025, unchanged from the previous year and 58% lower than in 1990.
- In 2025, new solar capacity totaling 14.9 GW and new wind capacity of 4.8 GW were connected to the grid (as of November).
- Over the course of 2025, Germany exported 54.3 TWh of electricity and imported 76.2 TWh, resulting in a net import surplus of nearly 22 TWh.
-
Sources: Fraunhofer ISE, MaStR, UBA
Electricity Generation in 2025: Renewables Dominate the German Power Mix
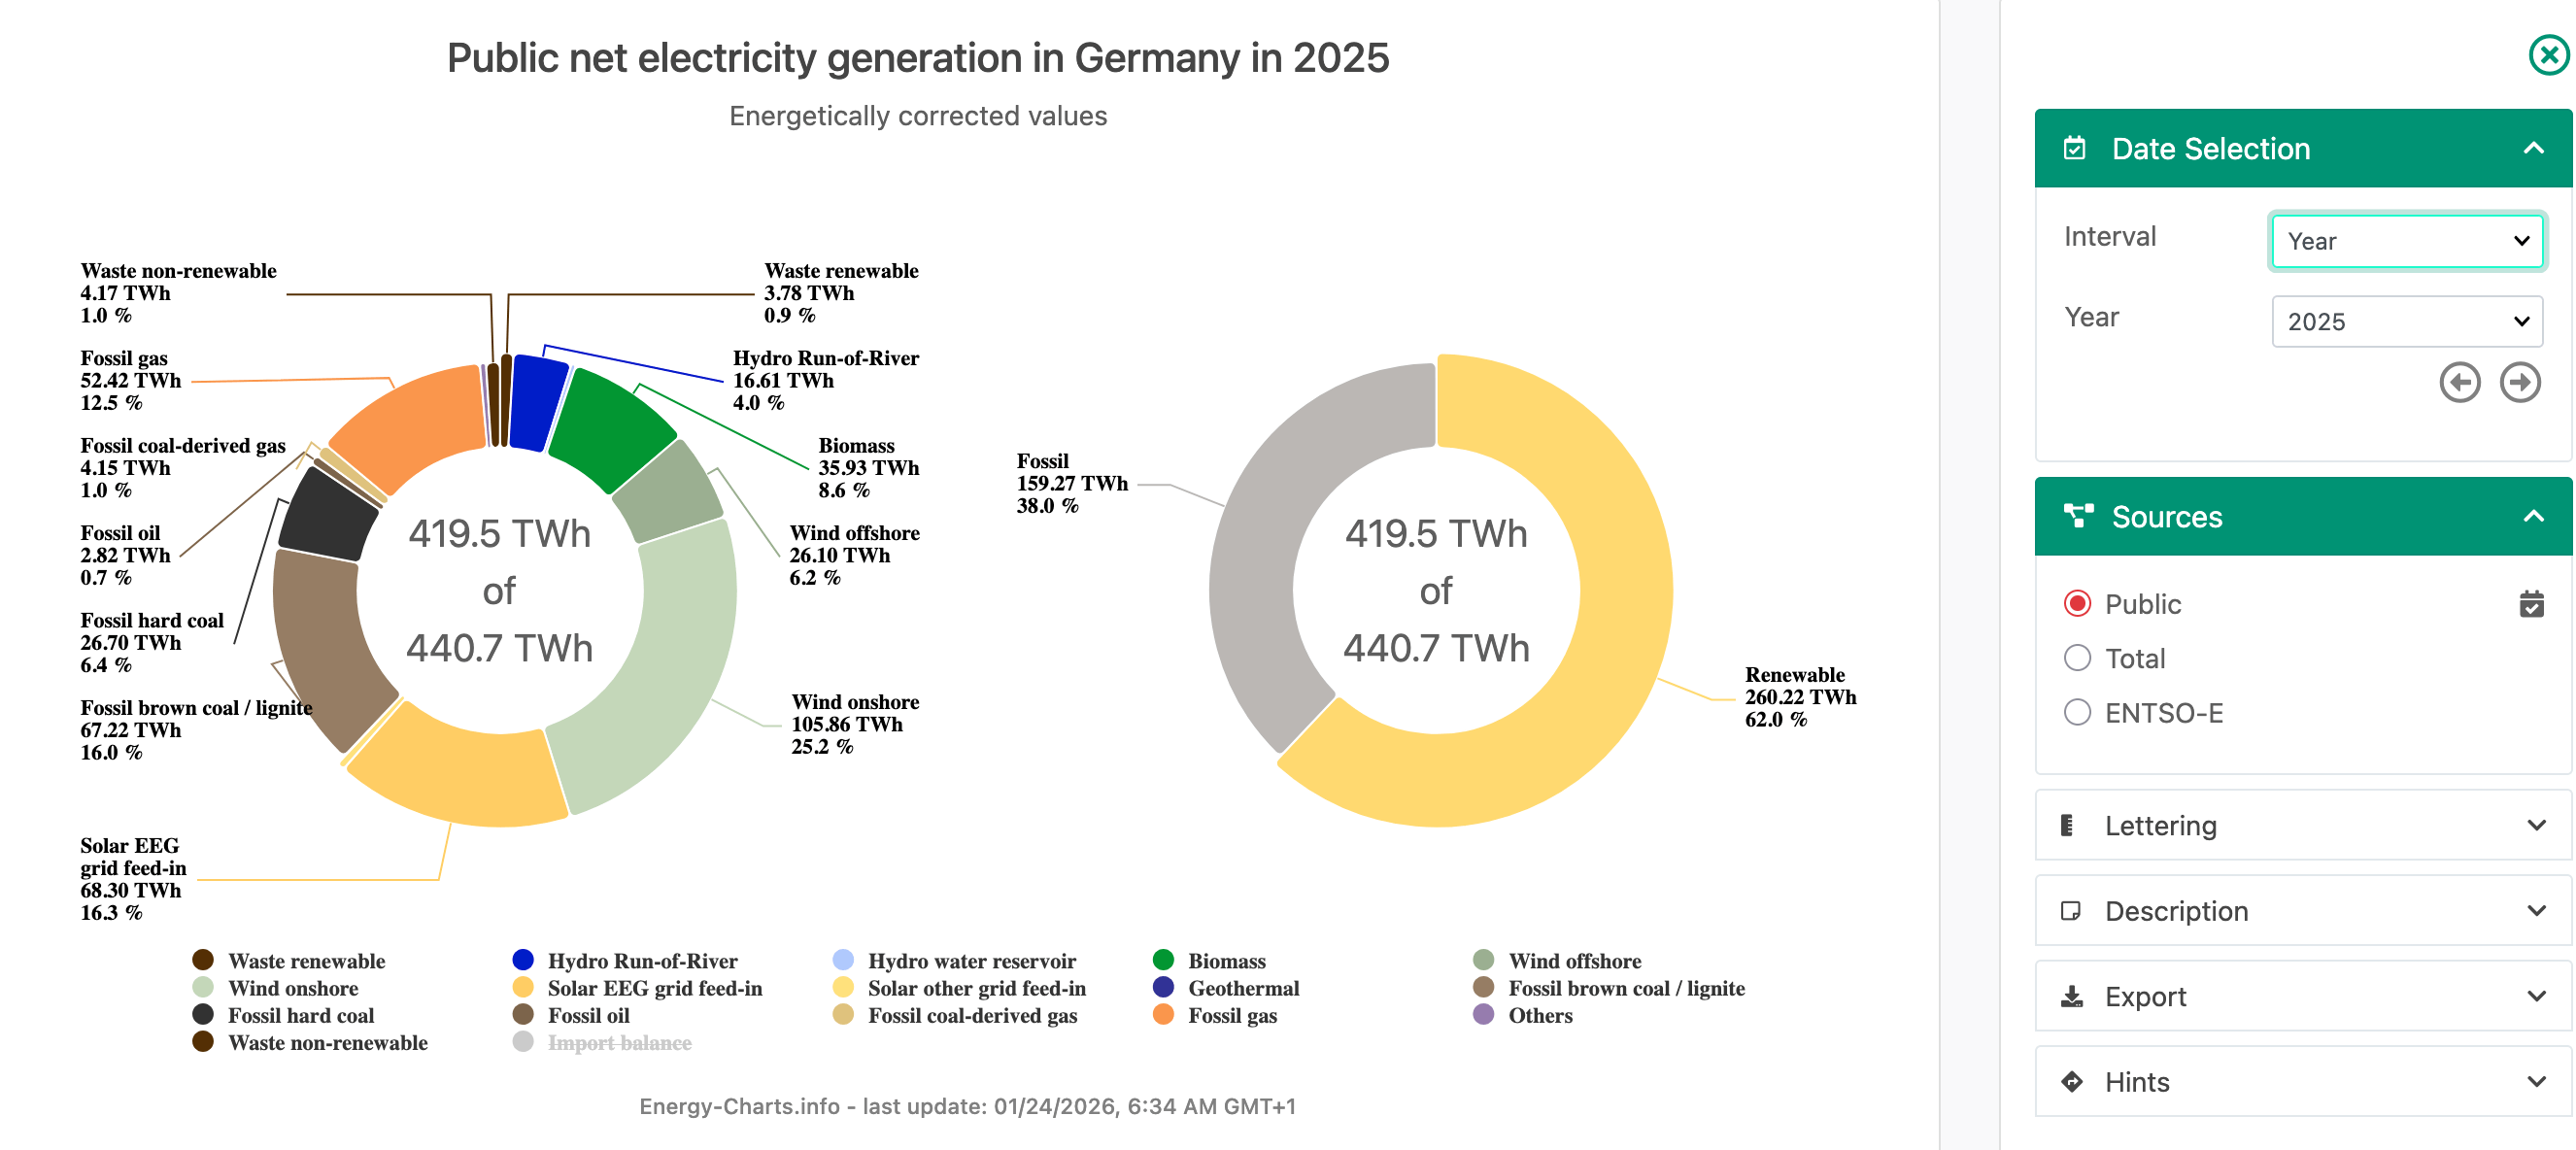
Electricity generation in Germany in 2025 was dominated by renewable energy sources, which accounted for 62% of total electricity output.
As in the previous year, wind power ranked first. With around 132 terawatt-hours (TWh), output was about 3.2% below the 2024 level, yet wind remained Germany’s single largest source of electricity in 2025. Onshore wind accounted for the majority, contributing around 106 TWh, while offshore wind farms added roughly 26 TWh. Feed-in levels were particularly high in autumn and winter, with onshore capacity peaking at 46.4 gigawatts (GW) at the end of October and offshore capacity reaching 8.0 GW shortly before year-end.
Solar power showed even stronger momentum, emerging as the new number two in the electricity mix. Photovoltaic systems generated around 87 TWh in 2025—an increase of roughly 21%, or about 15 TWh, compared with the previous year. Of this total, 70 TWh were fed into the public grid, while 16.9 TWh were consumed on-site. Within the public electricity mix, solar power overtook lignite for the first time, moving into second place in net electricity generation. On individual summer days, photovoltaic output played a dominant role: on June 20, it temporarily covered up to 98.6% of public load, with a maximum daily share of 41.2%.
Hydropower had a weaker year. Due to low precipitation, electricity generation from hydropower declined to 17.8 TWh, down from 22.3 TWh in the previous year. Installed capacity, however, remained largely unchanged at just under 5.9 GW.
Biomass plants generated around 41.1 TWh, including 36.0 TWh supplied to the grid and 5.1 TWh used for self-consumption—a slight decline compared with 2024.
Taken together, renewable energy sources—including wind, solar, hydropower, biomass, and geothermal—produced around 282 TWh of electricity in 2025. Of this, 260 TWh were fed into the public grid. Renewables accounted for 62% of the public electricity mix in 2025 and 59% when self-consumption is included. Self-consumption of renewable electricity totaled 22 TWh.
On the conventional side, the decline in coal-fired generation continued. Lignite-fired power plants generated a net 67.2 TWh for public supply, along with 1.5 TWh for industrial self-consumption—nearly 4 TWh less than in the previous year. Gross generation fell to a level last seen in the early 1960s. Hard coal generation increased slightly, reaching a net 26.7 TWh, but gross output also remained at a historically low level.
Gas-fired power plants moderately increased output. They supplied 52.4 TWh to the public electricity system and an additional 26.1 TWh for industrial self-generation, with a further 4.1 TWh produced from coal gas. Overall, electricity generation from gas exceeded the previous year’s level.
The high level of coal use in 2022 and parts of 2023 was largely an exceptional situation, driven by outages at French nuclear power plants and extremely high gas prices. As electricity markets stabilized from 2023 onward, a clear normalization set in, which in 2025 was reflected in the continued decline of coal’s role in the power mix.
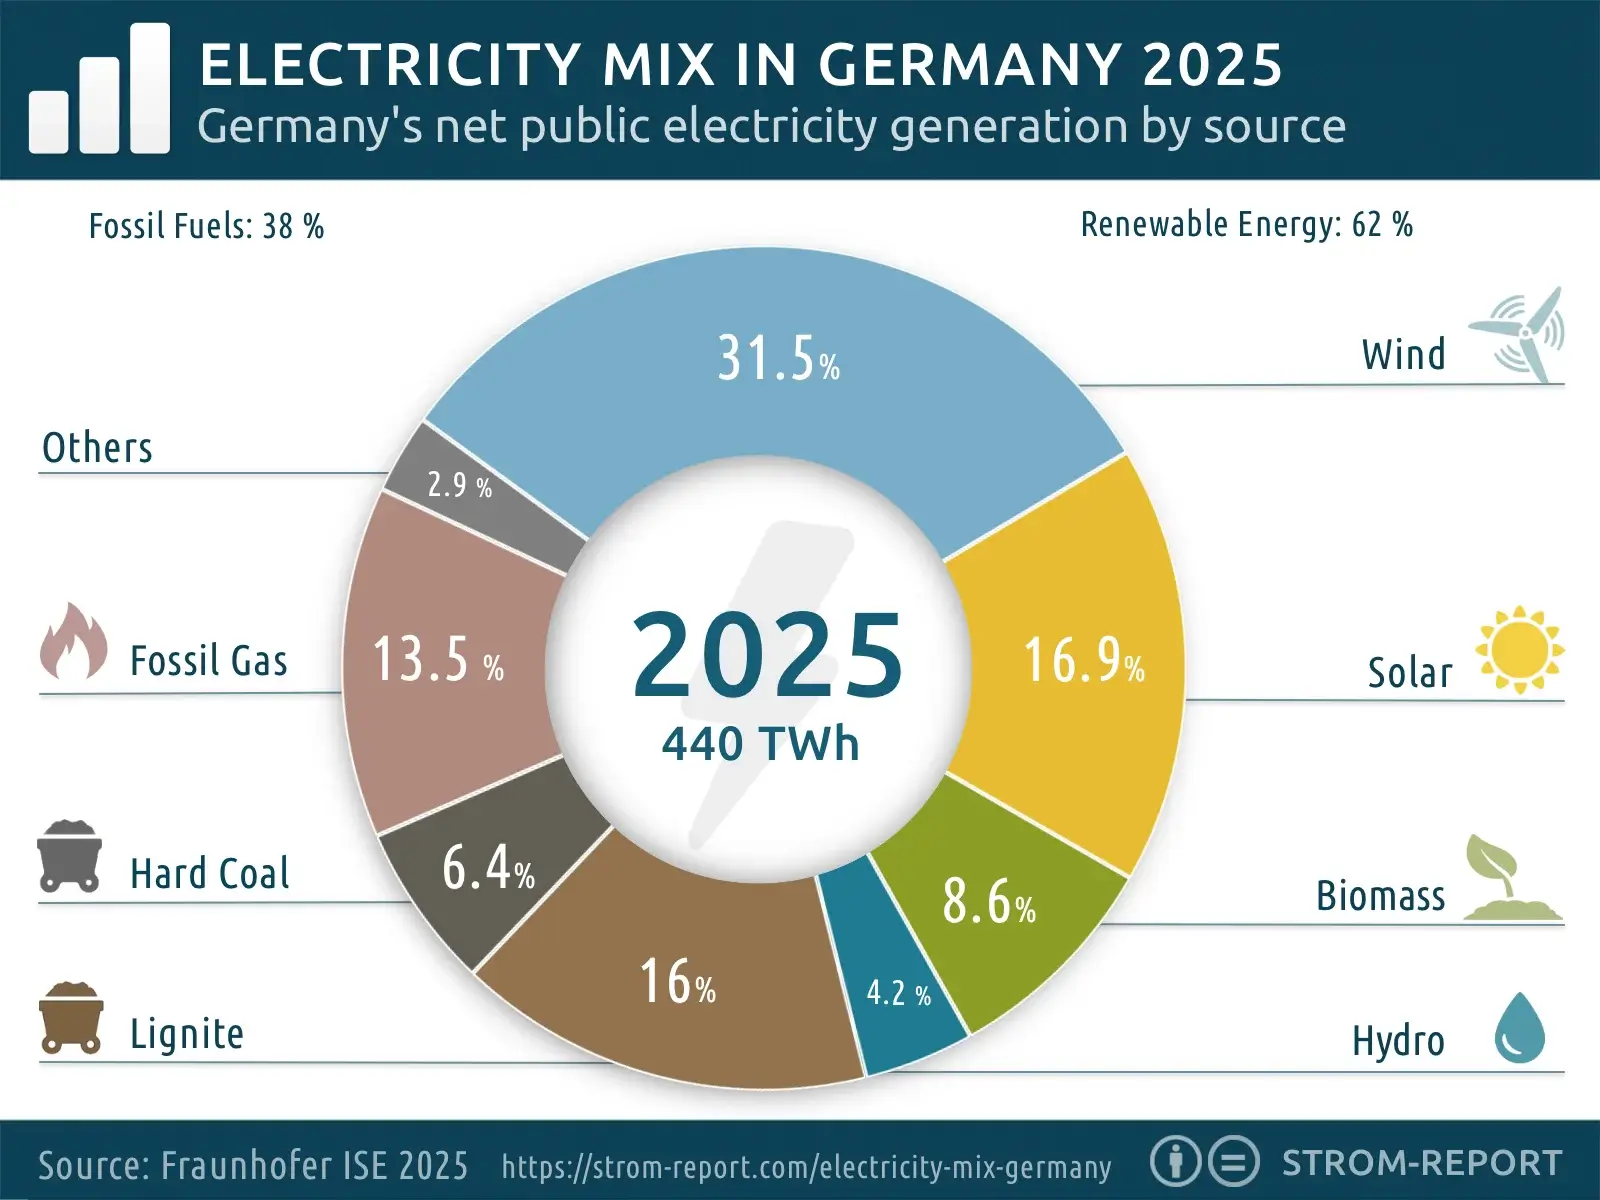
Germany’s Electricity production in 2025 by Source
| Period Energy Source |
Q1 2025 |
Q2 2025 |
Q3 2025 |
Q4 2025 |
Electricity Mix 2025 |
Share (%) Electricity Mix 2025 |
|---|---|---|---|---|---|---|
| Wind | 33.18 TWh | 26.96 TWh | 26.96 TWh | 44.8 TWh | 131.9 TWh | 31.5% |
| Solar | 10.97 TWh | 28.33 TWh | 23.7 TWh | 7.6 TWh | 70.6 TWh | 16.9% |
| Biomass | 9.6 TWh | 8.71 TWh | 8.31 TWh | 9.35 TWh | 35.97 TWh | 8.6% |
| Hydropower | 4.29 TWh | 4.48 TWh | 5.17 TWh | 3.85 TWh | 17.79 TWh | 4.2% |
| Renewable Waste | 0.86 TWh | 0.95 TWh | 0.8 TWh | 1.17 TWh | 3.78 TWh | 0.9% |
| Lignite | 21.27 TWh | 13.04 TWh | 15.22 TWh | 17.68 TWh | 67.21 TWh | 16% |
| Fossil Gas & Coal Gas | 19.73 TWh | 7.63 TWh | 7.78 TWh | 21.41 TWh | 56.55 TWh | 13.5% |
| Hard Coal | 10.22 TWh | 4.19 TWh | 4.37 TWh | 7.92 TWh | 26.7 TWh | 6.4% |
| Oil | 0.82 TWh | 0.61 TWh | 0.62 TWh | 0.77 TWh | 2.82 TWh | 0.7% |
| Non-Renewable Waste | 0.95 TWh | 1.05 TWh | 0.88 TWh | 1.29 TWh | 4.17 TWh | 1% |
Calculation by Fraunhofer ISE, based on net generation data from power plants supplying the public electricity system. Preliminary result covering 419 of 440 TWh, status as of January 1, 2026., energy-charts.info, PNG
Bleiben Sie informiert mit unserem Newsletter
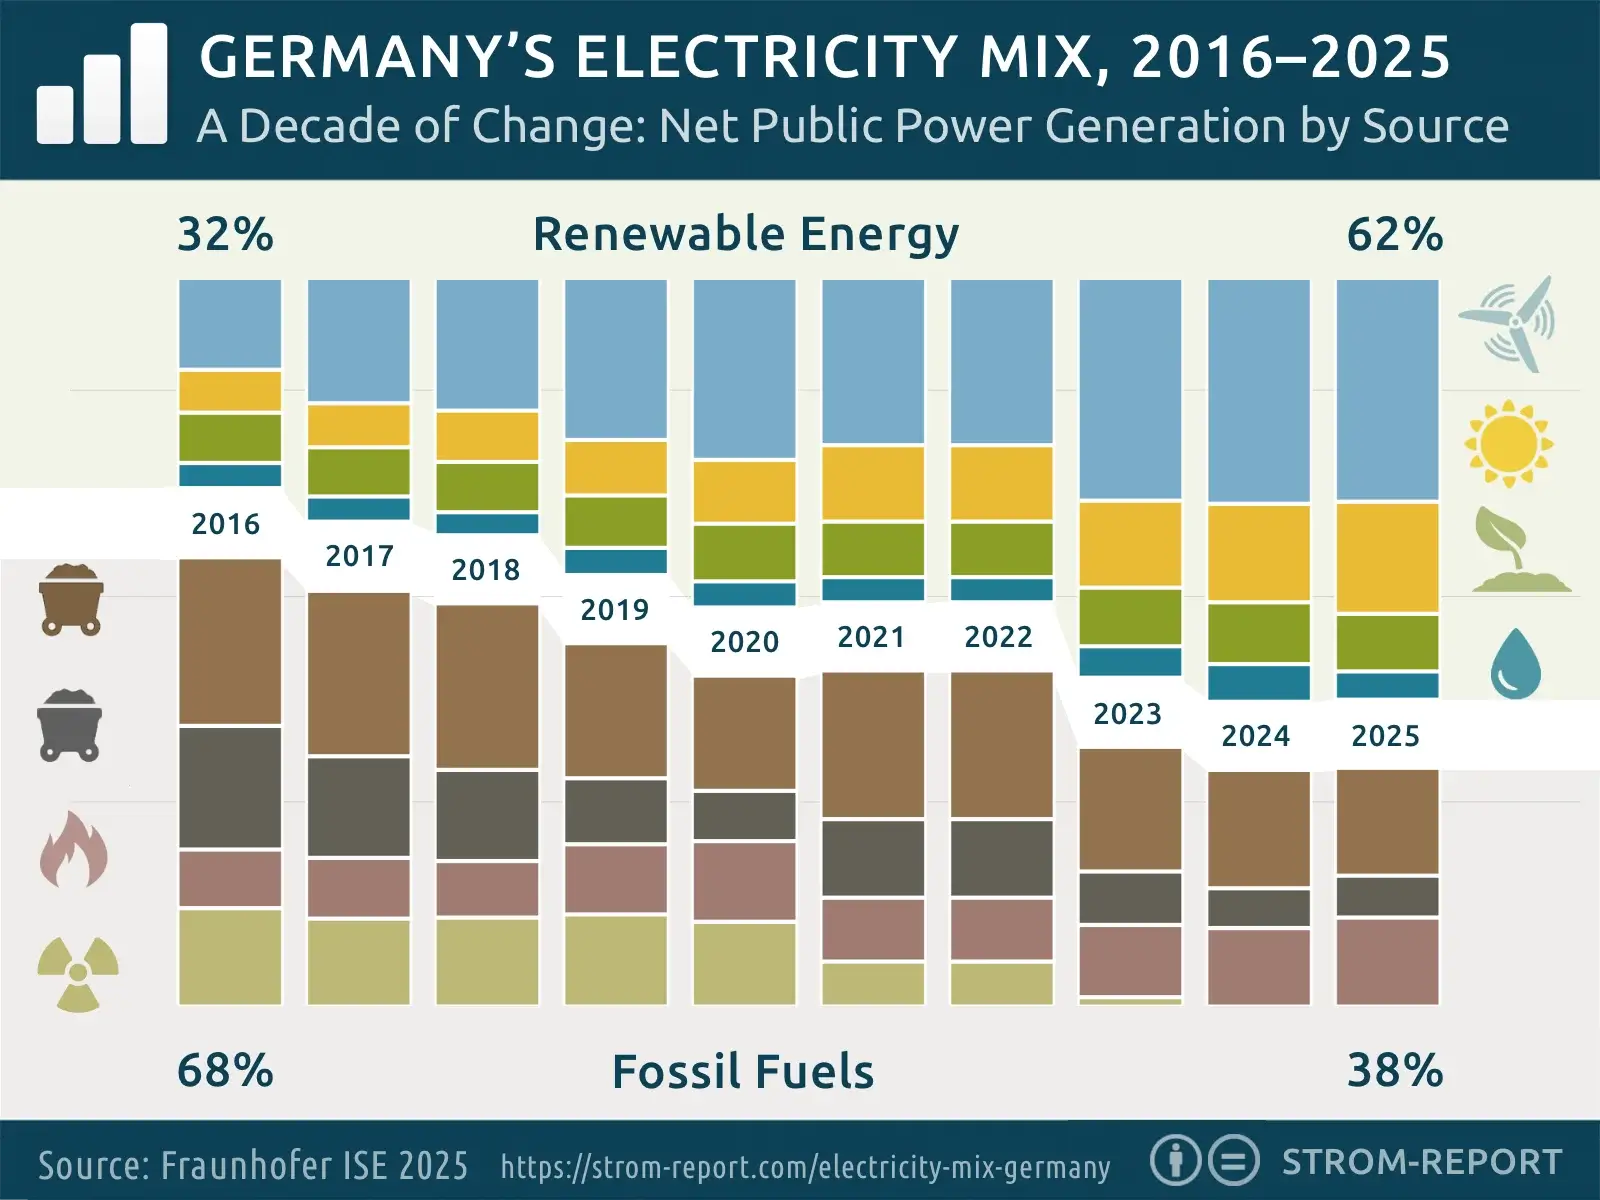
A Decade of Change: Germany’s Electricity Mix, 2016–2025
Ten years ago, Germany’s electricity mix looked fundamentally different. Conventional energy sources dominated generation. Fossil-fuel power plants—above all lignite and hard coal, supplemented by gas and nuclear power—accounted for 68% of electricity output. Renewable energy was expanding, but at 32% it had not yet set the pace.
Between 2015 and 2025, Germany underwent a profound structural transformation. Wind, solar, biomass, and hydropower doubled their share of the electricity mix. By 2025, around 62% of electricity generation came from renewable sources, driven primarily by wind and solar power.
Conventional energy sources lost significant ground. Coal consumption fell to its lowest level in decades, while nuclear power was reduced to a marginal role. With the final phase-out of nuclear energy at the end of 2023, nuclear power disappeared entirely from Germany’s domestic electricity generation.
Long-term Trend
Despite short-term fluctuations, Germany has completed its nuclear phase-out in 2023 and is steadily expanding renewable energy capacity, targeting a 80% share by 2030. This shift is intended to progressively reduce reliance on coal, which is scheduled to be phased out by 2038 or potentially earlier.
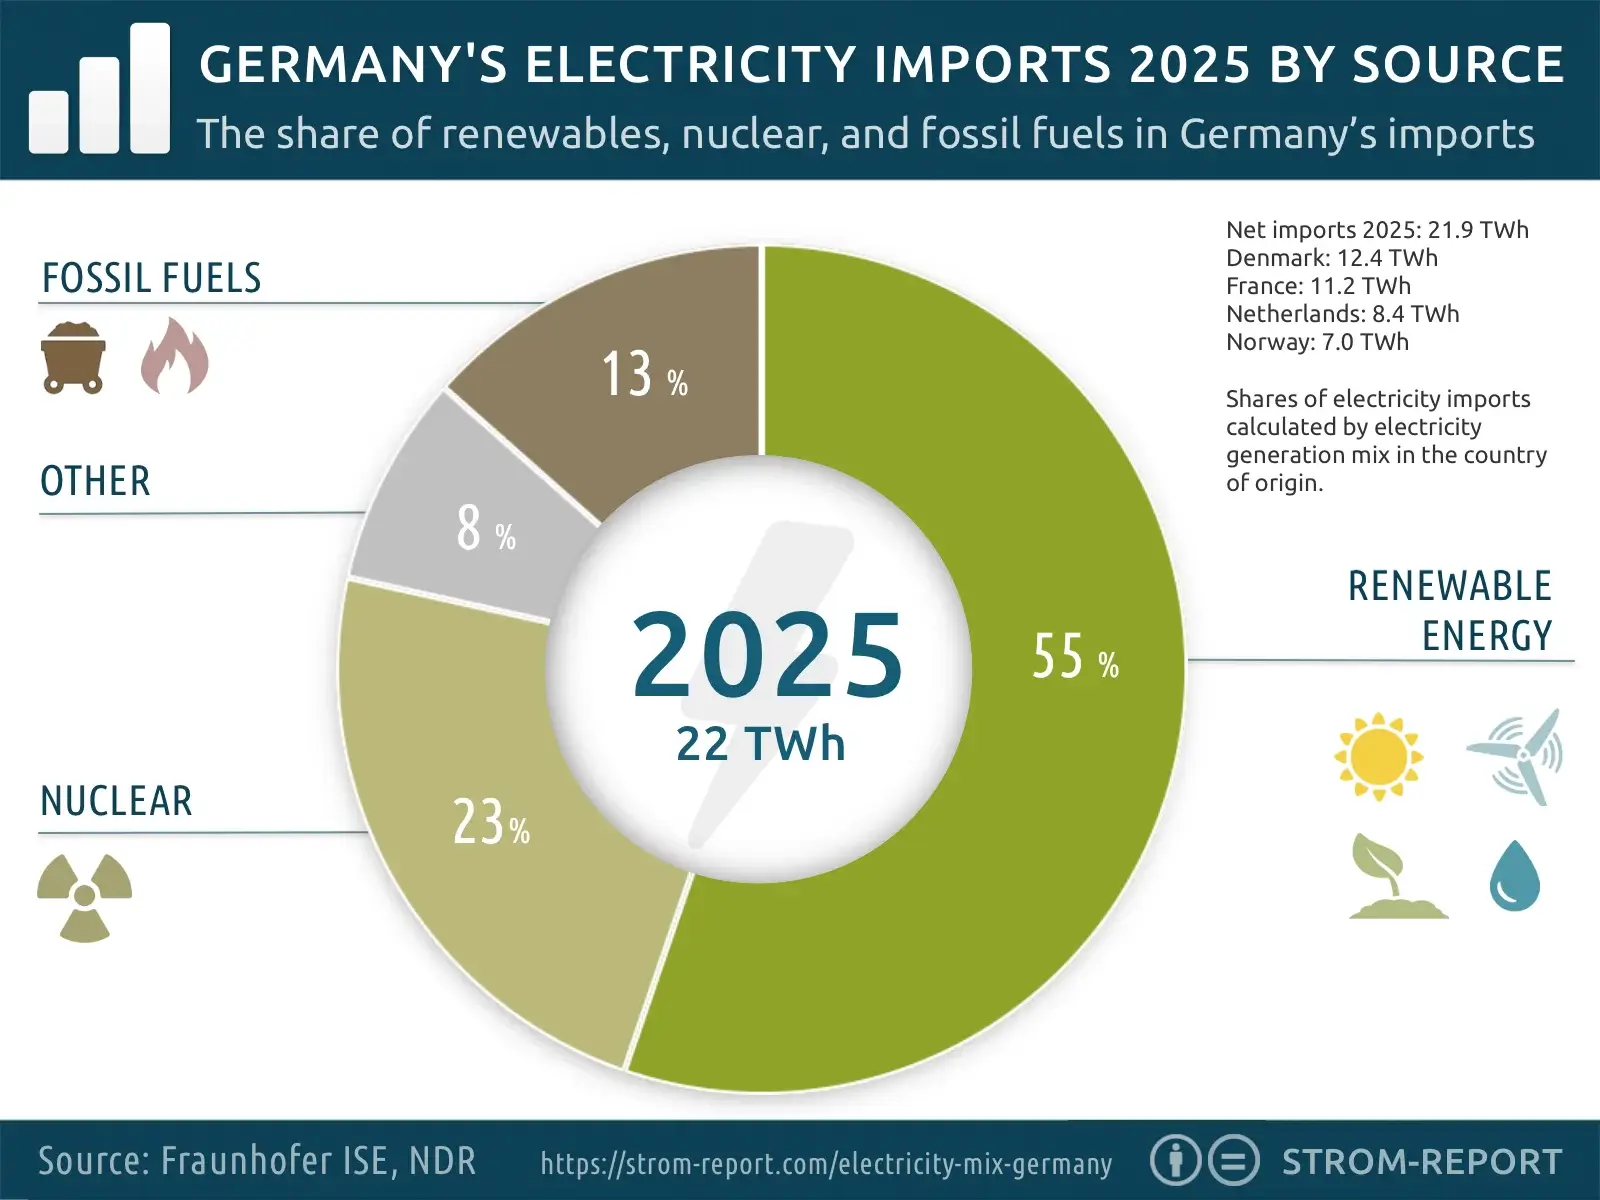
Electricity Trade in 2025: How Much Nuclear Power Did Germany Really Import?
Germany’s electricity consumption in 2025 once again underscored a key reality of the energy transition: it does not stop at national borders. Germany’s power system is closely interconnected with those of its neighbors. While the country has sufficient generating capacity on paper, it nevertheless remained a net importer of electricity.
In total, Germany imported around 76.2 terawatt-hours (TWh) of electricity in 2025 and exported 54.3 TWh. This resulted in a net import surplus of approximately 21.9 TWh—6.4 TWh less than in the previous year.
Denmark Replaces France as Germany’s Largest Electricity Supplier
A notable shift occurred among Germany’s main supplier countries. While France had been Germany’s primary source of electricity imports in the previous year, Denmark took over that position in 2025, followed by France, the Netherlands, and Norway. On the export side, Germany primarily supplied electricity to Austria, the Czech Republic, Luxembourg, and Poland.
The electricity trade balance—defined as the difference between imports and exports—thus stood at around 22 TWh in favor of imports in 2025.
Electricity Import
| Rank | Import Country | Electricity Volume 2025 |
|---|---|---|
| 1 | Denmark | 12.4 TWh |
| 2 | France | 11.2 TWh |
| 3 | Netherlands | 8.4 TWh |
| 4 | Norway | 7.0 TWh |
| 5 | Belgium | 2.9 TWh |
| 6 | Sweden | 2.4 TWh |
Electricity Export
| Rank | Export Country | Electricity Volume 2025 |
|---|---|---|
| 1 | Austria | 12.2 TWh |
| 2 | Czech Republic | 4.2 TWh |
| 3 | Luxembourg | 3.5 TWh |
| 4 | Poland | 3.4 TWh |
Nuclear Power - or How Green Was Imported Electricity?
A central question remains: where does imported electricity actually come from? A precise allocation by energy source is technically not possible. To provide an approximation, import volumes can be combined with the average electricity mix of the exporting countries at the time of delivery.
This method produces estimates rather than exact proofs of origin. It also does not account for the fact that some electricity in exporting countries may itself have been imported. Based on research by German broadcaster NDR using data from the Fraunhofer Institute, the picture for 2025 is as follows: around 55% of imported electricity came from renewable sources (approximately 12.1 TWh), 13% from fossil fuels, and 23% from nuclear power.
On this purely statistical basis, nearly a quarter of Germany’s imported electricity was generated by nuclear power—primarily in France.
Estimated Energy Mix of Germany’s Electricity Imports
| Month / Energy Source | Renewable | Nuclear | Other | Fossil |
|---|---|---|---|---|
| 1 | 0.35 TWh | 0.08 TWh | 0.01 TWh | 0.07 TWh |
| 2 | 0.91 TWh | 0.13 TWh | 0.11 TWh | 0.35 TWh |
| 3 | 1.17 TWh | 0.29 TWh | 0.19 TWh | 0.38 TWh |
| 4 | 1.41 TWh | 0.62 TWh | 0.17 TWh | 0.36 TWh |
| 5 | 1.06 TWh | 0.48 TWh | 0.19 TWh | 0.12 TWh |
| 6 | 0.75 TWh | 0.28 TWh | 0.08 TWh | 0.05 TWh |
| 7 | 1.70 TWh | 0.77 TWh | 0.26 TWh | 0.32 TWh |
| 8 | 1.57 TWh | 1.02 TWh | 0.37 TWh | 0.43 TWh |
| 9 | 1.04 TWh | 0.51 TWh | 0.16 TWh | 0.17 TWh |
| 10 | 0.07 TWh | 0.03 TWh | 0 TWh | 0.01 TWh |
| 11 | 1.31 TWh | 0.58 TWh | 0.17 TWh | 0.42 TWh |
| 12 | 0.79 TWh | 0.31 TWh | 0.05 TWh | 0.27 TWh |
| Total | 12.13 TWh | 5.10 TWh | 1.77 TWh | 2.96 TWh |
| Share (%) | 55.25% | 23.22% | 8.07% | 13.46% |
Quelle: Fraunhofer ISE, Stand 31.12.2024, vorläufiges Ergebnis für 413 von 438 THW
Why Germany Imports Electricity Despite Sufficient Power Plants
European electricity trading follows a simple principle: price. Power is purchased where it is cheapest at any given moment. Imports are typically driven not by shortages, but by economic efficiency.
While Germany can generally meet its own demand, gas- and coal-fired power plants are often more expensive to operate than wind power from Denmark or hydropower from Norway. For utilities, importing electricity is therefore frequently the more cost-effective option.
Conclusion: Nuclear Power Played a Role—but Was Not the Driver
Germany imported less electricity in 2025 than in the previous year, yet clearly remained a net importer. A substantial share of imported electricity was renewable, although nuclear power continued to play a relevant role. The decisive factor, however, was not energy policy—but market logic. Electricity trade follows price signals.
Image Gallery: How Germany’s Electricity Mix Has Evolved
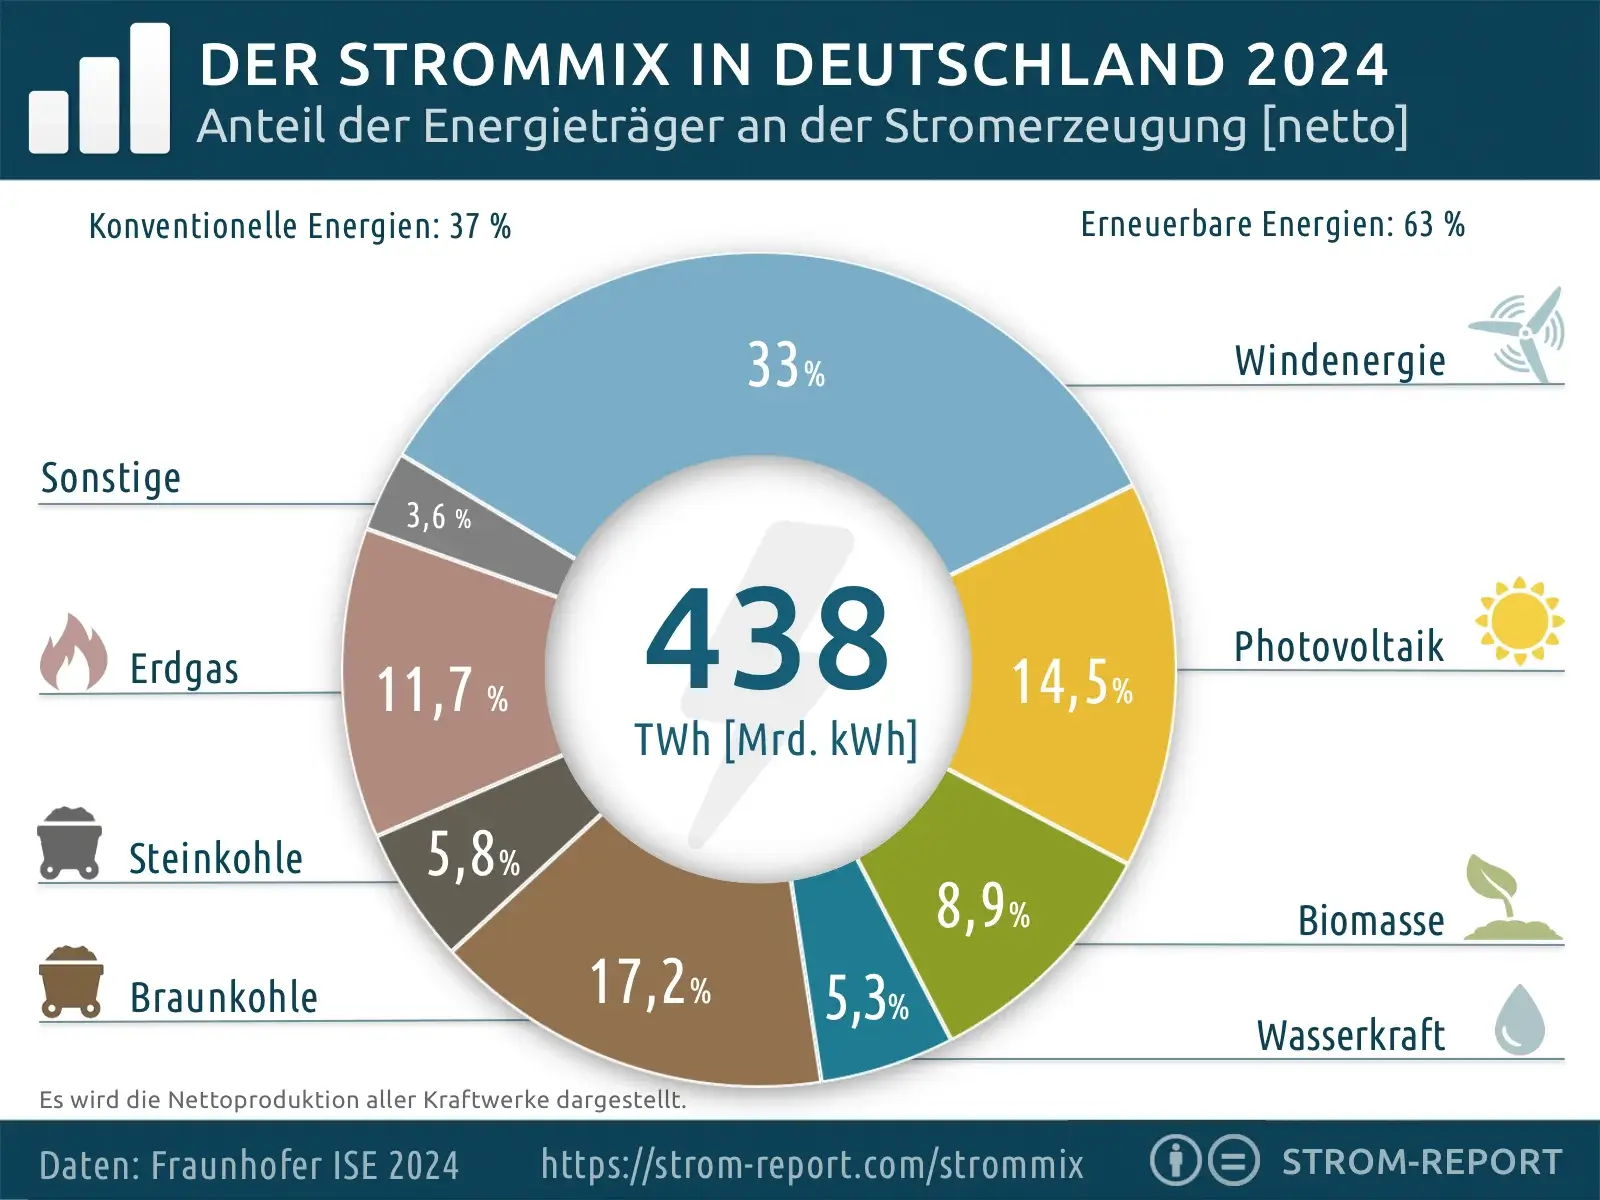
Electricity Mix 2024
Renewable Energy 65%
Fossil Fuel 35%
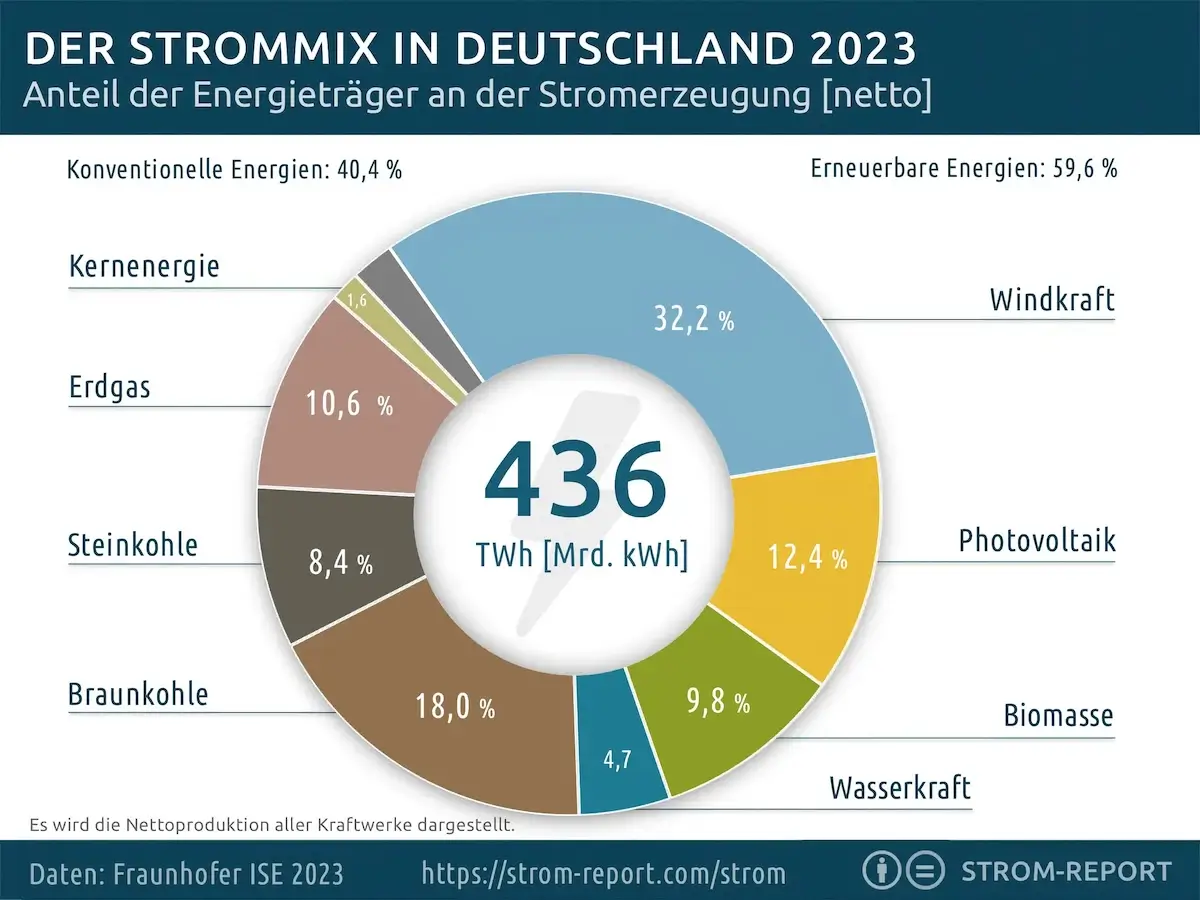
Electricity Mix 2023
Renewable Energy 59.6%
Fossil Fuel 40.4%
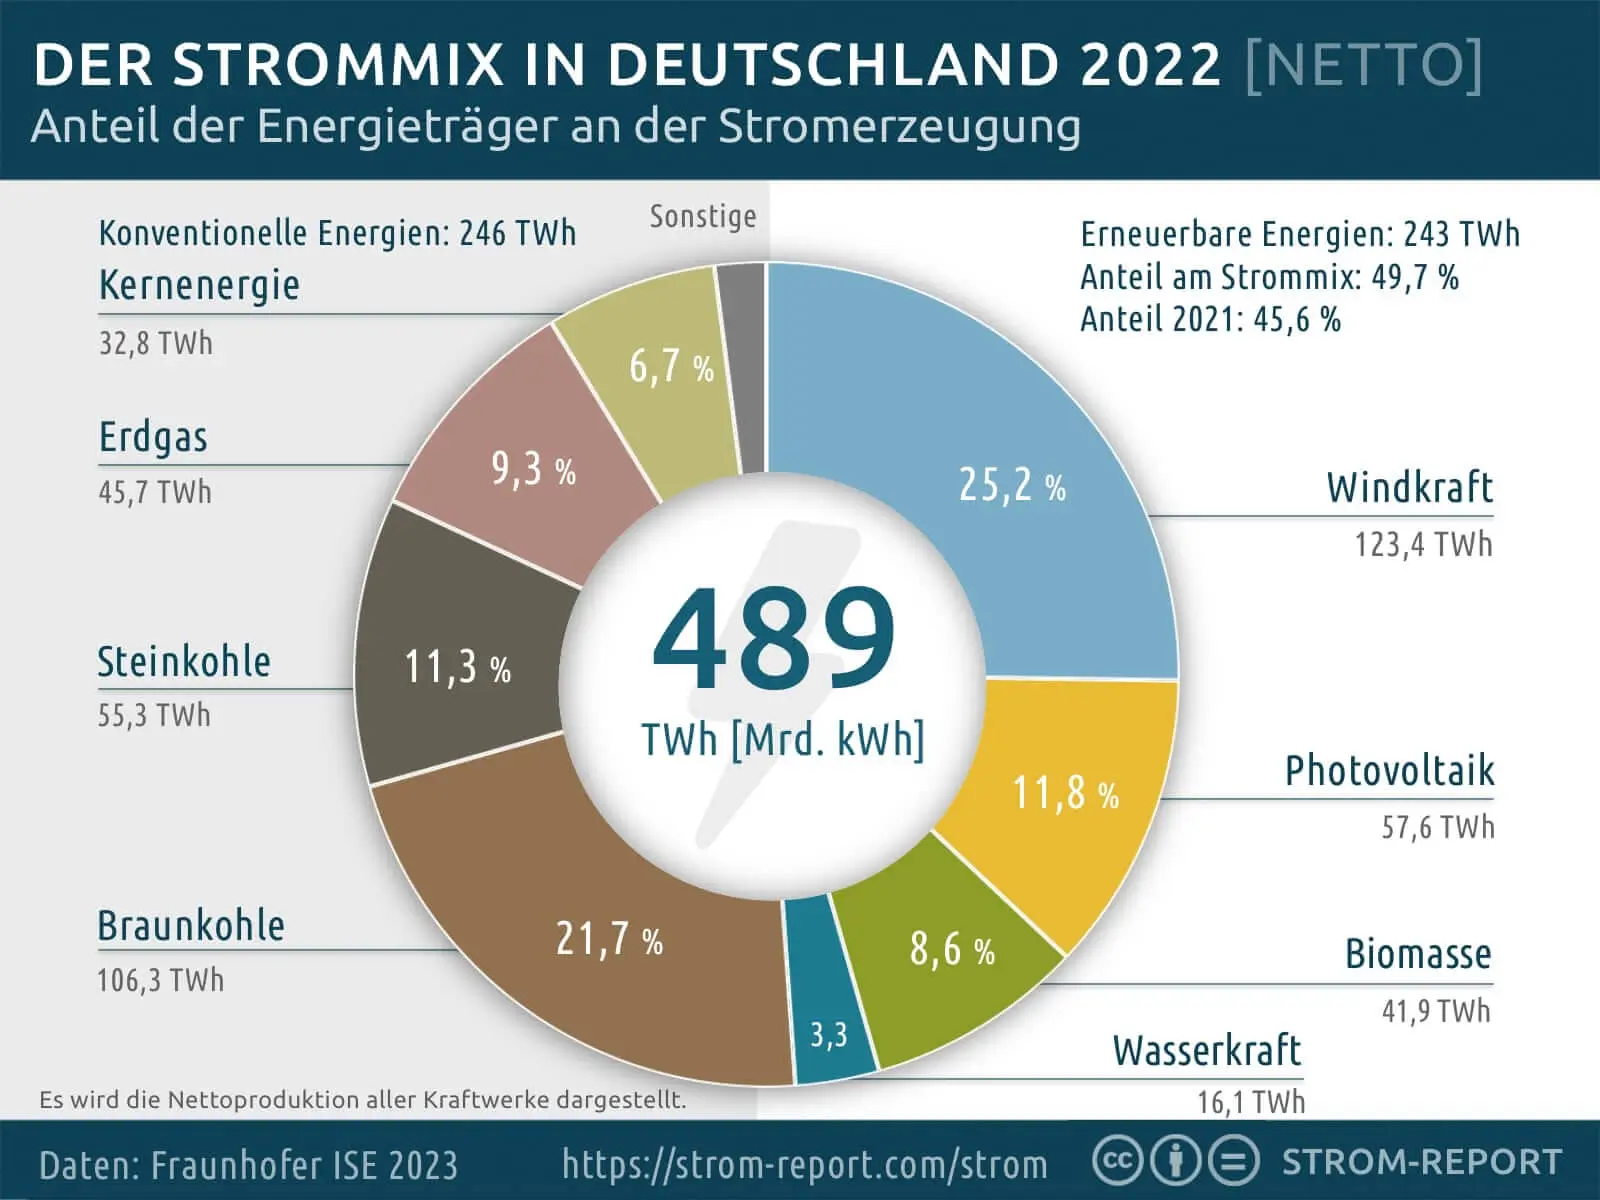
Electricity Mix 2022
Renewable Energy 49.7%
Fossil Fuel 50.3%
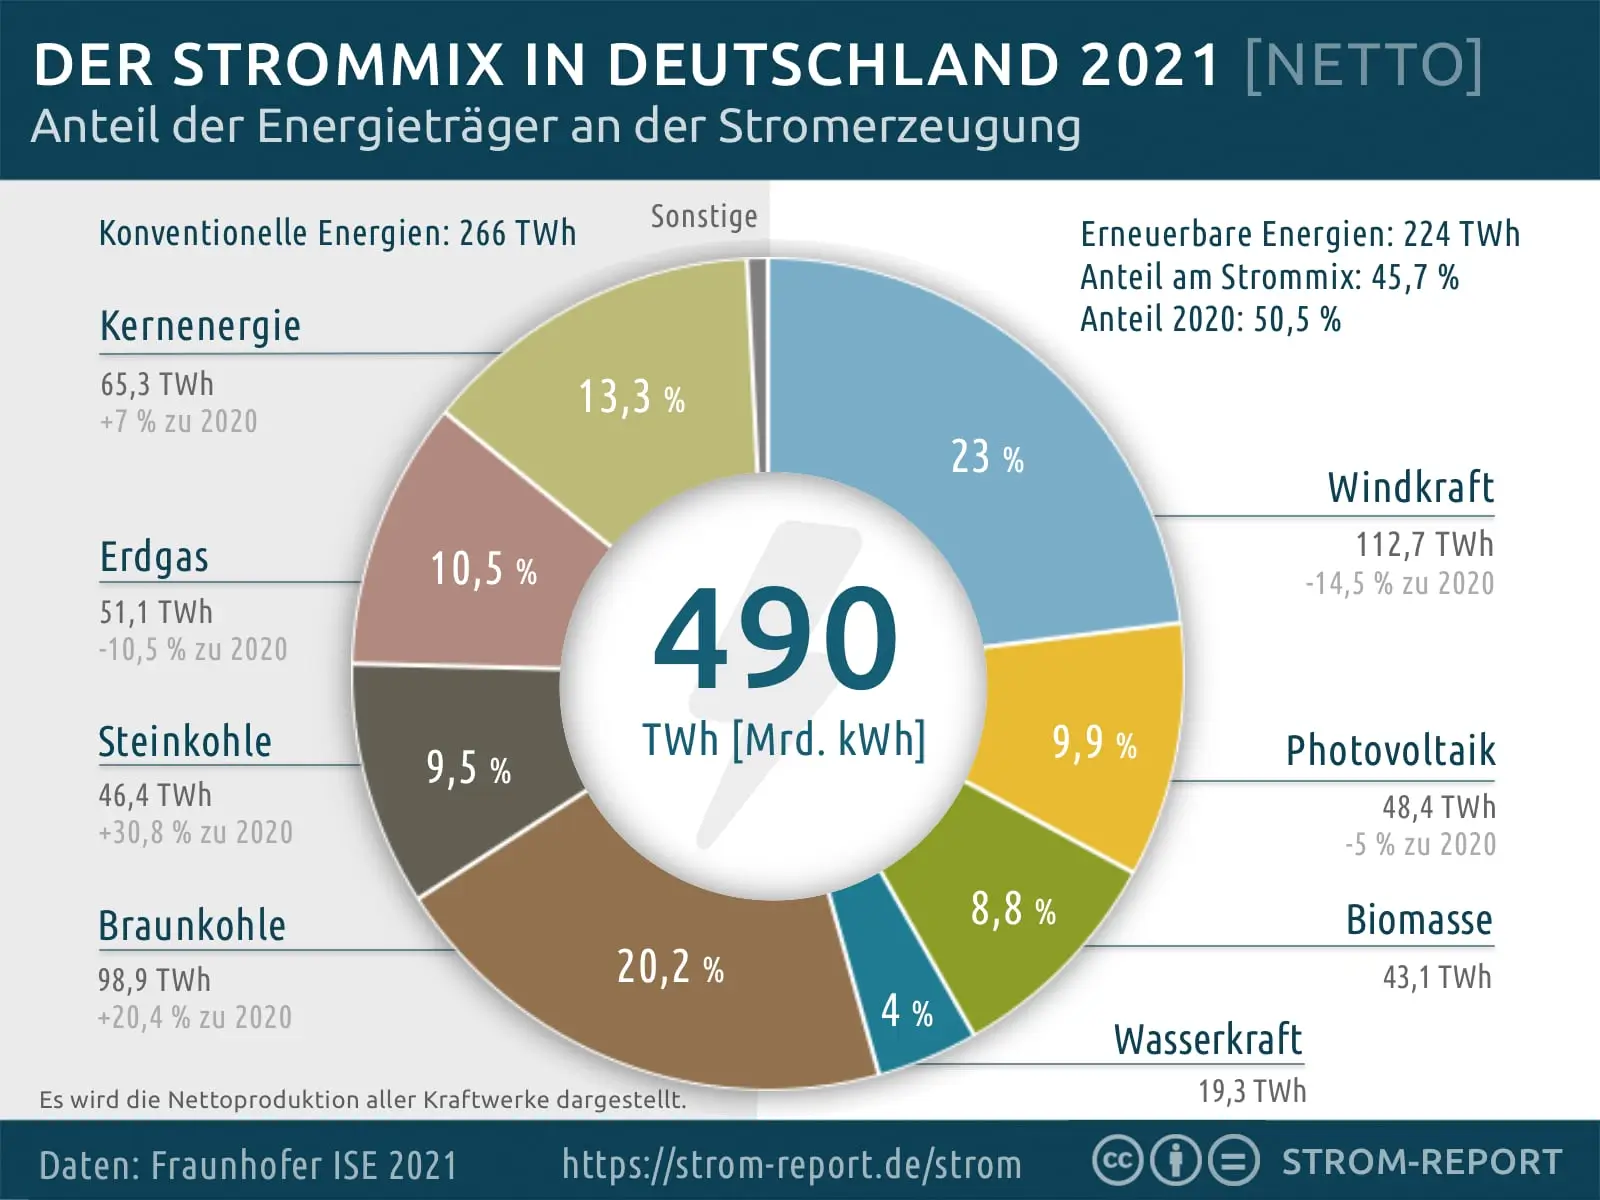
Electricity Mix 2021
Renewable Energy 45.7%
Fossil Fuel 54.3
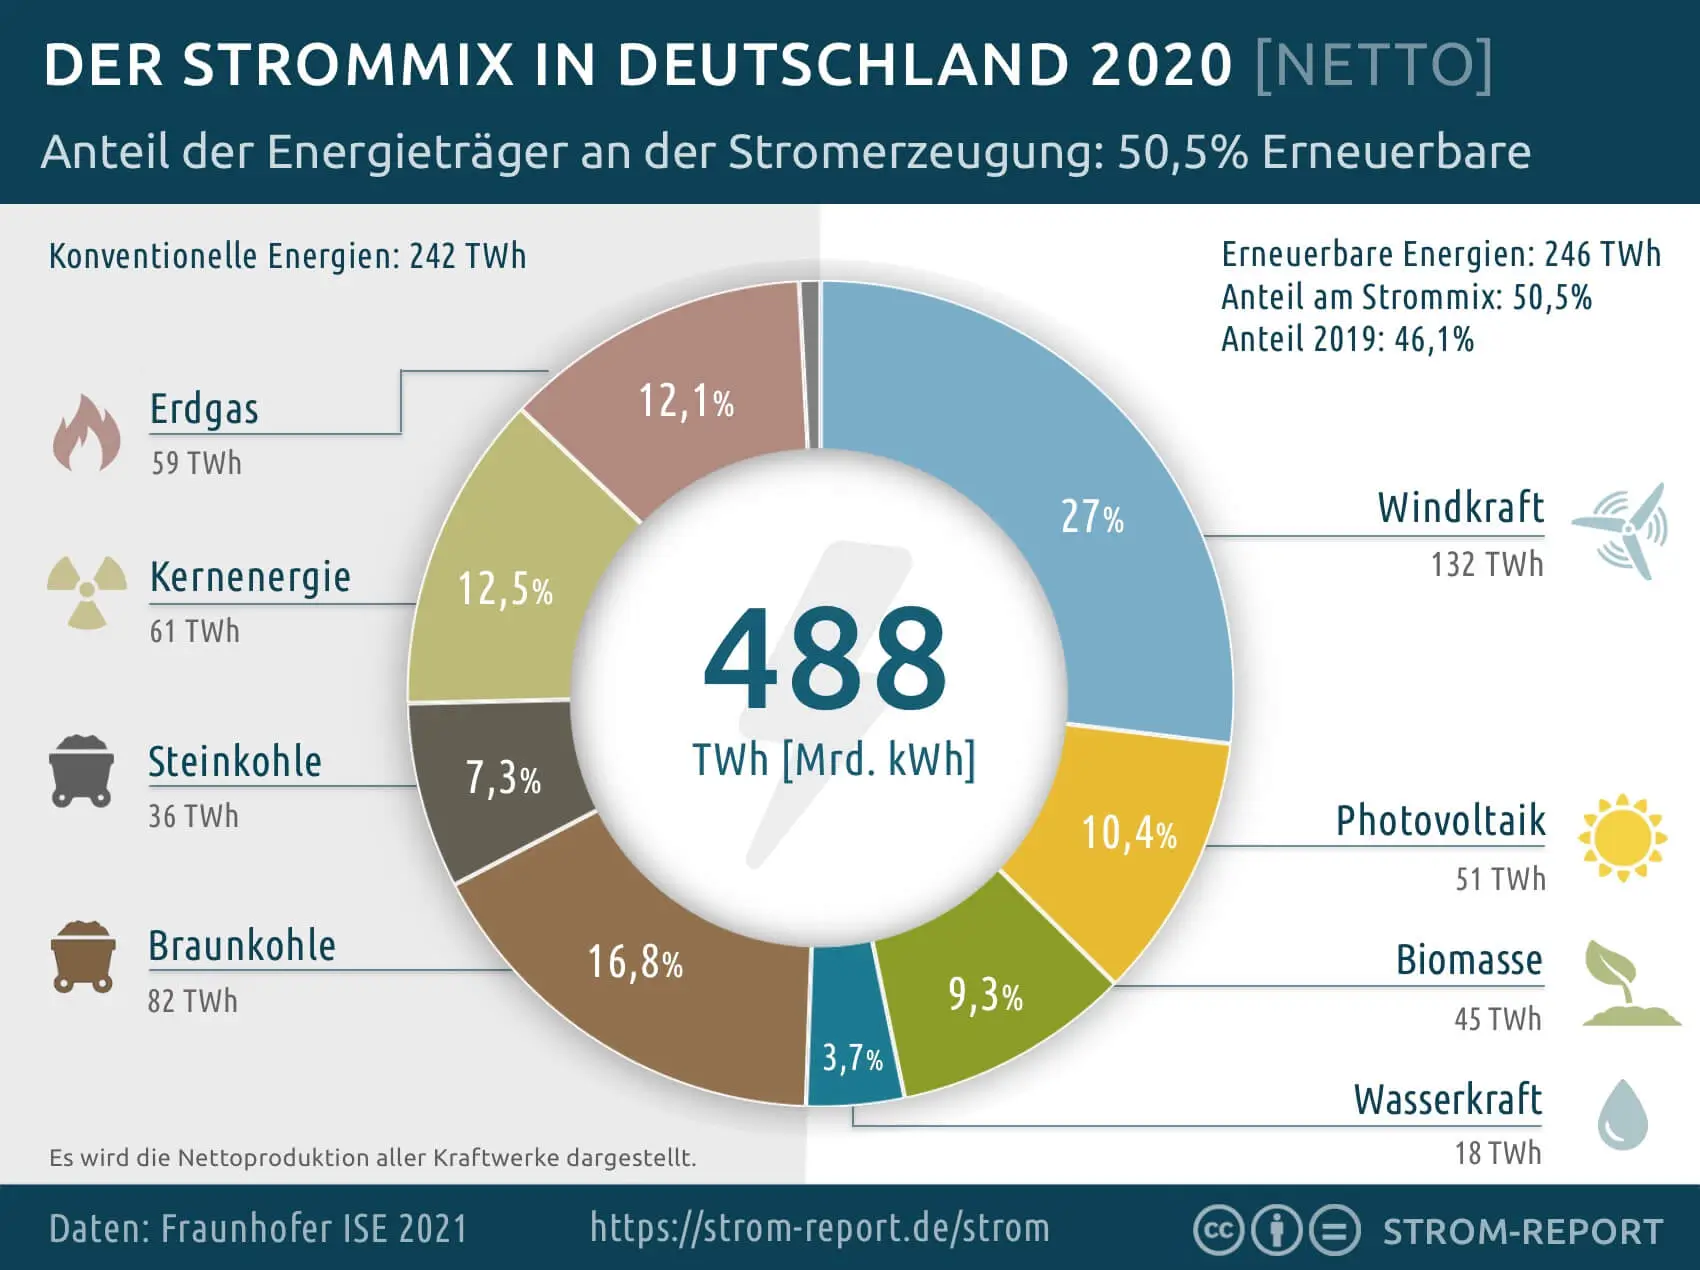
Electricity Mix 2020
Renewable Energy 50.5%
Fossil Fuel 49.5%
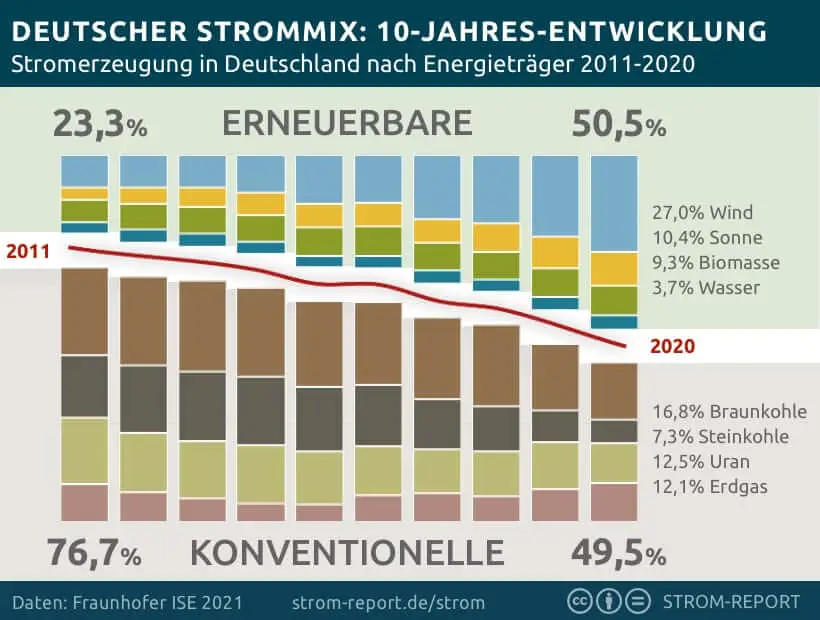
Electricity Mix 2011-2020
The share of renewable electricity increased from 23% in 2011 to 51% in 2020.
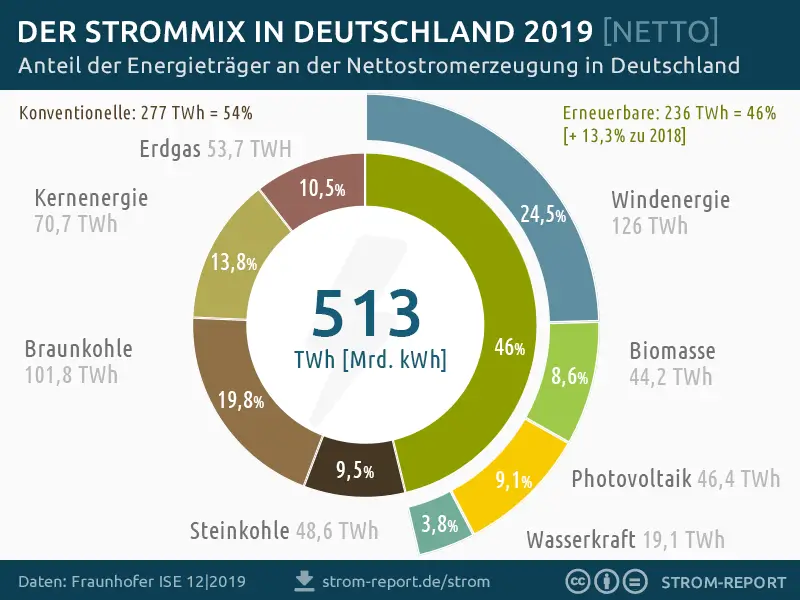
Electricity Mix 2019
Renewable Energy 46%
Fossil Fuel 54%
Electricity Mix 2018
Renewable Energy 40.2%
Fossil Fuel 59.8%
Electricity Mix 2017
Renewable Energy 38.5%
Fossil Fuel 61.5%
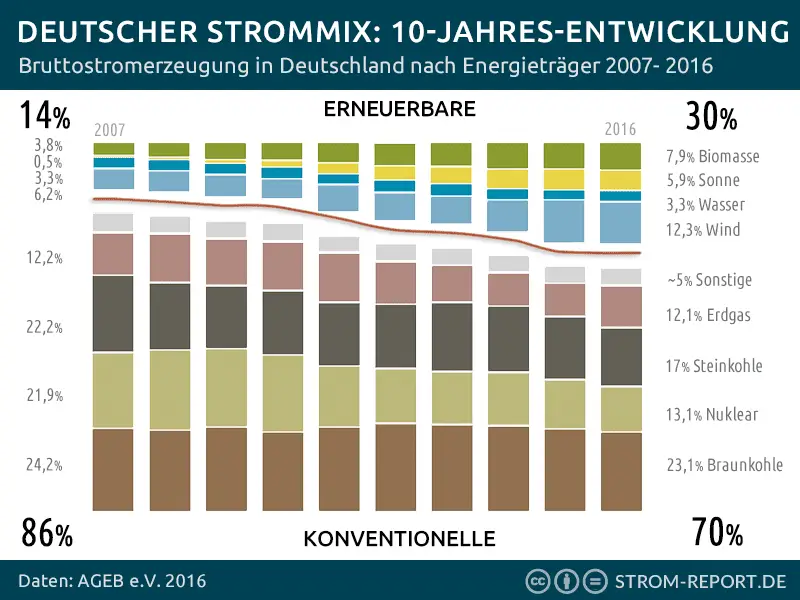
Electricity Mix 2007-2016
The share of renewable electricity increased from 14% in 2007 to 30% in 2016.
Questions About the Electricity Mix
Electricity Mix: Where Does the Power From My Socket Come From?
Germany’s national electricity mix is not the same as the mix of individual electricity suppliers. The electricity mix for each household or business depends on its specific supplier.
Electricity providers in Germany are subject to disclosure requirements. They must inform customers about the composition of the electricity they supply, broken down by energy sources. This information is typically available on suppliers’ websites and on most electricity comparison platforms, which show the percentage shares of the different energy carriers used to generate the power.
What Is the Difference Between Gross and Net Electricity Generation?
Gross electricity generation refers to the total volume of electricity produced in Germany.
Net electricity generation deducts the electricity consumed by power plants themselves for operation, as well as on-site self-consumption of solar power. In coal-fired power plants, internal consumption typically accounts for around 7–8%.
Net electricity generation therefore corresponds to the electricity mix that actually reaches end consumers via the power socket.
How Much Renewable Electricity Is Needed to Reach Climate Targets?
To meet the federal government’s climate targets for 2030, Germany aims to cover 80% of its gross electricity consumption with renewable energy sources.
To accommodate rising electricity demand from the heating sector and transport—particularly due to electrification—renewable electricity generation will need to increase to around 600 terawatt-hours (TWh) based on current estimates. This would require more than a doubling of current renewable output.
What Is the Cheapest Energy Source in Germany?
The question of which energy source is cheapest for electricity generation can be answered clearly: photovoltaic power currently has the lowest generation costs in Germany.
The production cost of one kilowatt-hour of electricity from solar power ranges between 2 and 6 euro cents per kWh.
Source: Fraunhofer ISE, 2021
For comparison (generation costs per kWh, 2021):
Wind power: 4–8 euro cents
Coal-fired power: 10–20 euro cents
Nuclear power: 14–19 euro cents
These figures refer to so-called levelized cost of electricity (LCOE)—the direct costs incurred during power generation. External follow-up costs, such as environmental damage or health impacts, were not included in the Fraunhofer Institute’s calculation and would add to the overall cost.
The cost of CO₂ emission allowances was included, though not at today’s higher price levels of around €80 per tonne.
Study: Cost of Electricity – Renewable Energy (Fraunhofer ISE)
Source: Electricity generation data are based on calculations by Fraunhofer ISE, drawing on information from the transmission system operators 50Hertz, Amprion, TenneT and TransnetBW, as well as data from Destatis and the European Energy Exchange (EEX). The figures presented refer to net generation from power plants supplying the public electricity system. energy-charts.info
Other Sources: BMWK, Destatis, BDEW, ZSW, AEE, AGEB, Agora Energiewende
About Strom-Report
Strom‑Report is an independent data and analysis platform covering the German electricity market. It provides reporting on power generation, electricity prices, market trends, and energy transition developments, alongside a consumer-facing electricity tariff comparison.